1 / 12
Arrow keys / Click to navigate
SDSC 8013 — Categorical Data Analysis

Determinants of IPO First-Day
Performance Categories
under China’s Registration-Based System

An ordinal logistic regression analysis of 796 A-share IPOs (2022–2025), examining how issuance characteristics, firm fundamentals, and market conditions shape the ordered classification of first-day returns.

796 IPO Samples
4 Years
14 Predictors
3 Models
IPO First-Day Return Distribution
796 IPOs Total
13.9% Break (<0%)
54.6% Mild (0–100%)
23.5% Sig. (100–300%)
7.9% Surge (≥300%)
N = 796 • A-Share IPOs • 2022–2025
01
Section 1 — Introduction

Background & Literature

A well-documented empirical regularity across global capital markets is IPO underpricing—shares offered at prices systematically below their first-day closing price (Ljungqvist, 2007).

Rock (1986) proposed the Winner’s Curse model: underpricing compensates uninformed investors facing adverse selection. Beatty & Ritter (1986) showed that greater ex ante uncertainty leads to higher underpricing, with investment banks’ reputation as enforcement. Ritter & Welch (2002) emphasized that IPO phenomena are non-stationary.

China’s A-share market historically exhibited average first-day returns exceeding 100% during certain periods (Chen, 2022), attributed to the approval-based system’s implicit 23× P/E ceiling—creating systematic mispricing and fueling speculation.

The CSRC launched registration-based reforms: STAR Market (2019) → ChiNext (2020) → full implementation across all boards (Feb 2023), removing administrative price controls, strengthening disclosure requirements, and shifting pricing power to the market.

2019
STAR Market
Pilot
2020
ChiNext
Reform
2023
Full
Implementation
2025
Study
Endpoint

Evidence Remains Mixed

Deng et al. find efficient STAR pricing, yet Li & Li show reform initially amplified speculation. Lyu documents a temporary efficiency dip before recovery. The relationship between reform and first-day performance is complex and evolving.

Deng et al. (2024)

STAR Market registration regime offers the most efficient pricing with lower investor overreaction.

• Decomposed initial returns into fair value & overreaction components

Li & Li (2022)

Market-oriented reform initially magnified initial returns due to amplified speculation.

• DID approach; pricing efficiency improvements require time

Lyu (2022)

Pricing efficiency declined in Year 1 of ChiNext reform, then gradually recovered.

• SFA model on 354 ChiNext & 119 STAR companies

Zou (2024)

Third-party government certification reduces information asymmetry under registration system.

• 1,312 firms (2019–2023); “Little Giant” effect most pronounced

01
Section 1 — Introduction

Research Gaps & Question

Gap 1
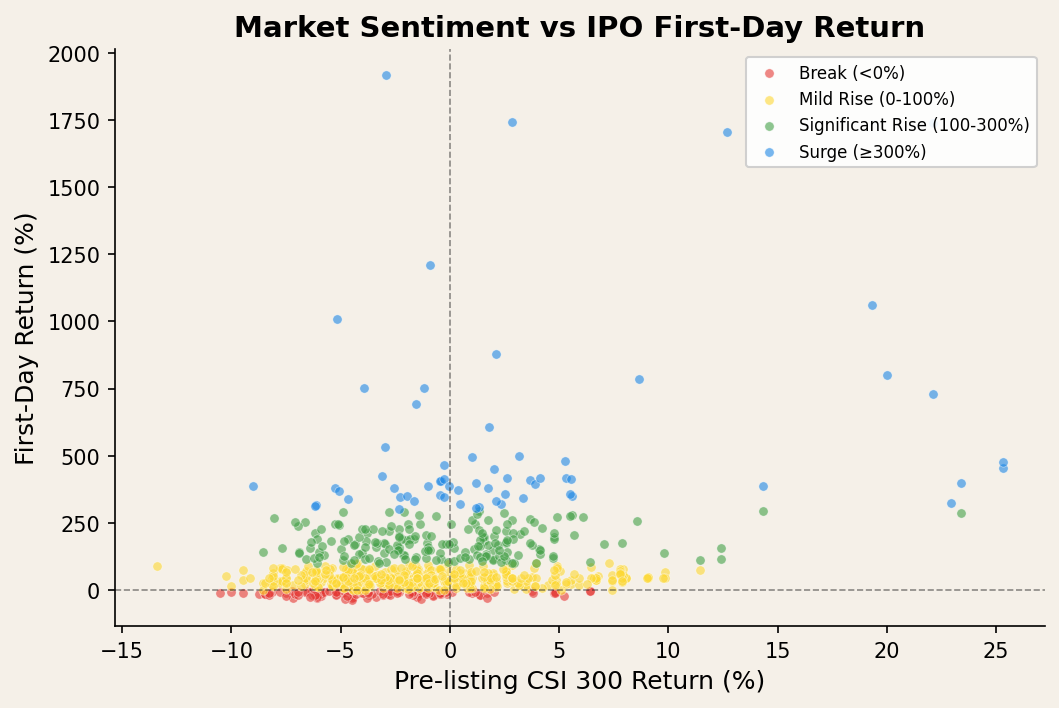
Outcome Specification

Most studies treat IPO first-day returns as a continuous variable (OLS) or binary outcome (underpriced vs. overpriced). In practice, a stock that breaks issue price, one that doubles, and one that triples carry qualitatively different implications for investors.

Gap 2
Temporal Coverage

Few studies have examined the full registration-era window (2022–2025) encompassing all board types under the unified system, including the 2023 full-rollout year.

Gap 3
Interaction Effects

Limited attention to how issuing characteristics interact with market-level conditions (e.g., does a high P/E issue perform differently in bull vs. bear markets?).

Research Question

RQ: Since the full implementation of the registration-based IPO system in China (2022–2025), which issuing characteristics, firm characteristics, and market conditions significantly influence the ordinal classification of IPO first-day performance?

Ordinal Perspective

4 ordered categories preserving natural ordering: Break / Mild Rise / Significant Rise / Surge. Unlike binary or continuous approaches, this captures the qualitative gradient of investor outcomes.

Full Coverage

796 non-financial IPOs across Main Board, ChiNext & STAR Market, Jan 2022–Dec 2025. Data sourced from Tushare Pro & cninfo/akshare, covering issuance records, first-day trading, financials, and market indices.

Multi-Dimensional

14 predictors spanning Issuance Firm Market dimensions, plus year & 33 industry fixed effects. Interactions: Board×PE, MktRet×PE.

02
Section 2 — Methods

Data, Sample & Variables

Sample Selection

972 initial records → −3 (no listing date) → −4 (financial sector) → −168 (BSE, no trading data) → −1 (out of period) → 796 Final Sample

Dependent Variable — 4 Ordered Categories

Ri = (Pclose,i − Pissue,i) / Pissue,i
111

Break (<0%)

13.9%

435

Mild Rise (0–100%)

54.6%

187

Sig. Rise (100–300%)

23.5%

63

Surge (≥300%)

7.9%

Independent Variables

CategoryVariableDefinition
IssuancePE_issueIssue P/E ratio
PriceIssue price (RMB)
log(Funds)ln(total proceeds)
BallotOnline lottery rate (%)
BoardListing board dummies
FirmSizeln(total assets)
LevDebt-to-asset ratio (%)
ROEReturn on equity (%)
RevGrowthRevenue growth (%)
MarketMktRet_preCSI 300 return (20d)
TurnoverFirst-day turnover (%)
UW_repTop-10 underwriter
IPO_countConcurrent IPOs (±30d)

+ Year FE & 33 Industry FE in extended models. Continuous variables Winsorized at 1st/99th pctl.

02
Section 2 — Methods

Model Specification & Diagnostics

Proportional Odds Model (Ordinal Logistic Regression)

log[ P(Yi ≤ j | Xi) ⁄ P(Yi > j | Xi) ] = αjβXi     j = 1, 2, 3

Model 1 — Baseline

Issuance characteristics only:
PE_issue, Price, log(Funds), Ballot, Board.
Tests whether offering structure alone predicts first-day category.

Model 2 — Full

+ Firm fundamentals (Size, Lev, ROE, RevGrowth) + Market conditions (MktRet_pre, Turnover, UW_rep, IPO_count) + Year & Industry FE.
Core specification for hypothesis testing.

Model 3 — Interaction

+ Board × PE_issue (does P/E effect differ by board?)
+ MktRet_pre × PE_issue (does market mood moderate P/E effect?)
Exploratory cross-level interactions.

Step 1
Baseline
5 issuance vars
Step 2
+ Firm & Market + FE
14 vars + controls
Step 3
+ Interactions
Board×PE, Mkt×PE
Validate
Brant + MNL
Robustness checks

Key Assumption: Parallel Lines

The proportional odds assumption requires that coefficients β remain constant across all J−1 cumulative logits. Assessed via the Brant test (overall + per-variable). If rejected → re-estimate with Multinomial Logistic Regression as robustness check; consistency between the two lends confidence to the ordinal conclusions.

Diagnostics — All Clear

VIF: All < 3 (max = 2.90) — no multicollinearity.
Min category n: 63 observations (Surge) — well above the conventional ≥10 threshold.
Winsorization: Continuous variables trimmed at 1st & 99th percentiles.
Missing values: <17% per variable, imputed via industry-median.
Software: R polr() (MASS), brant(), multinom() (nnet).

03
Section 3 — Results

Descriptive: Temporal Trends

22.3%

Break Rate 2022

0%

Break Rate 2025

0%

Surge Rate 2022

30.2%

Surge Rate 2025

6.7%
70.8%
22.5%
2022
n=329
19.5%
64.1%
14.3%
2023
n=251
23%
48.0%
28.0%
2024
n=100
30.2%
58.6%
11.2%
2025
n=116
Break
Mild Rise
Sig. Rise
Surge
Figure 1 — Performance by Year (100% Stacked)
0% 10% 20% 30% 2022 2023 2024 2025 22.5% 14.3% 1.0% 0% 0% 2.0% 23.0% 30.2% Break Rate Surge Rate
Figure 2 — Break Rate vs Surge Rate Over Time

Takeaway: Pricing efficiency improved dramatically—breaks vanished while surges emerged, reflecting full market adjustment to the registration system.

03
Section 3 — Results

Descriptive: Board & Market Sentiment

0% 20% 40% 60% 80% 71.4% 20.0% 7.6% MainBoard 14.7% 53.7% 24.5% 7.1% ChiNext 27.3% 52.3% 16.8% 3.6% STAR 20.0% 50.8% 27.7% BSE Break Mild Rise Sig. Rise Surge
Figure 3 — Performance by Listing Board
Market Scatter
Figure 4 — Market Sentiment vs First-Day Return
42.55

Mean P/E Ratio

SD: 47.13

¥33.97

Mean Issue Price

SD: 28.03

12.35

Proceeds (¥100M)

SD: 12.37

63.07%

Mean Turnover

SD: 22.90

-0.98%

Pre-listing MktRet

SD: 4.99%

03
Section 3 — Results

Ordered Logistic Regression

Issuance
log(Funds) — Strong Negative

Larger offerings constrain speculative upside, converging pricing toward intrinsic value. Coef: −2.011, p<0.01

OR0.134
Firm
Firm Size — Robust Positive

Capital gravitates toward larger enterprises offering greater certainty under the registration regime. Coef: 0.799, p<0.01

OR2.224
Market
MktRet_pre — Dominant Amplifier

Bullish sentiment dramatically amplifies first-day returns. Strongest single predictor in the model. Coef: 8.486, p<0.01

OR4,844
Market
Turnover — Liquidity Matters

Higher first-day liquidity is significantly associated with better performance categories. Coef: 0.072, p<0.01

OR1.075
Issuance
Ballot Rate — Negative

Oversubscribed IPOs with lower lottery rates show higher first-day returns. Coef: −5.921, p<0.01

OR0.003
Model 2 — Coefficient Estimates (log-OR)
MktRet_pre
8.49 ***
Year2025
1.51 ***
Size
0.80 ***
Year2024
0.79 ***
Year2023
0.70 ***
Turnover
0.07 ***
PE_issue
0.01
RevGrowth
0.01 ***
Price
-0.00
IPO_count
-0.02 ***
Bd:ChiNext
-1.56 ***
log(Funds)
-2.01 ***
Bd:STAR
-2.12 ***
Bd:BSE
-2.13 ***
Ballot
-5.92 ***
p<0.01
Not Sig.
Figure 5 — Model 2 Coefficients (Forest Plot)
03
Section 3 — Results

Assumption Testing & Robustness Checks

Brant Test — Rejects Parallel Odds

Overall: χ² = 142.12, df = 36, p < 0.001
Key violations: Board dummies (ChiNext: χ²=83.23), Turnover (χ²=16.33), Ballot (χ²=9.12), STAR (χ²=75.97), BSE (χ²=22.87).
Implication: The factors driving a “Break” outcome are asymmetric to those propelling a “Surge”—the proportional odds model may over-simplify the extremes.

Multinomial Logistic Regression

Key findings confirmed:
• log(Funds): coef −1.052 to −3.154 across categories
• MktRet_pre: increasing effect (6.920 → 15.511)
• Turnover: progressive coefficients (0.319 → 0.609)
• 3-category & 5-category schemes yield consistent results

Sensitivity Analysis

Re-estimated with alternative DV thresholds:
3-category: Merge Mild & Significant Rise → consistent signs & significance
5-category: Split Surge into two tiers → core conclusions hold
Results are not driven by arbitrary categorization.

0% 20% 40% 60% 80% 100% TURNOVER RATE BY PERFORMANCE CATEGORY 46.8 Break 67.5 Mild Rise 77.7 Sig. Rise 83.9 Surge
Figure 6 — Turnover by Performance Category

Takeaway

Higher-performing categories exhibit systematically higher turnover, supporting the liquidity channel hypothesis. The ordinal model provides a useful summary, but the Brant test violation confirms asymmetric drivers across categories—multinomial results and sensitivity analyses both validate the core conclusions.

04
Section 4 — Discussion

Interpretation of Key Findings

Our results corroborate the progressive improvement in pricing efficiency under the registration reform, aligning with Ritter & Welch’s (2002) assertion on the non-stationarity of IPO phenomena.

Issuance Characteristics

Fundraising scale (OR=0.134) constrains speculative upside. Ballot rate (OR=0.003) confirms oversubscription as a barometer of returns. Notably, the P/E ratio’s economic magnitude is trivial (OR=1.006)—after removing the 23× cap, the valuation multiple is no longer a core determinant.

Connects to: Lin & Zhang (2024)—market-oriented pricing is the most direct pathway to reducing underpricing.

Firm Characteristics

Firm size (OR=2.224) shows a robust positive effect—counter-intuitive, as smaller-caps might be expected to surge more. Under registration, capital gravitates toward larger enterprises. ROE and leverage are insignificant: short-term trading is decoupled from profitability fundamentals.

Connects to: Qian et al. (2025)—financial indicators matter more for pricing efficiency than pricing-related factors.

Board & Market Conditions

STAR, ChiNext & BSE all negative vs. Main Board (ORs: 0.119–0.211), consistent with Lyu’s (2022) investor learning hypothesis. Market sentiment is the paramount amplifier (MktRet_pre OR=4,844). Break rate: 22.3% (2022) → 0% (2025) validates sustained pricing efficiency.

Connects to: Lyu (2022)—investor learning & rational calibration follow initial reform volatility.

Methodology Considerations

Brant test rejects proportional odds (p<0.001): asymmetric drivers between “Break” and “Surge.” Multinomial logistic confirms turnover & sentiment effects are magnified in extreme right-tail categories—liquidity-driven frenzies.

Implication: The ordinal model provides a useful summary, but category-specific effects warrant further investigation.

04
Section 4 — Discussion

Limitations, Future Directions & Policy

Limit 1
⚠ Sample Selection

Exclusion of 168 BSE IPOs due to data unavailability introduces selection bias. First-day price limits on the Main Board may also truncate observed returns. Future: Extend to full board spectrum once BSE data becomes available.

Limit 2
⚠ Variable Omission

No micro-level book-building variables (institutional bid dispersion, pricing adjustments). DV categorization thresholds carry inherent subjectivity. Future: Integrate granular bidding data alongside underwriter adjustments.

Limit 3
⚠ Endogeneity & Behavior

Potential endogeneity between turnover and first-day returns not fully addressed. Behavioral underpinnings of extreme surges remain underexplored. Future: Social media sentiment, textual analysis, investor attention metrics.

Policy Implications — For Regulators

The near elimination of price breaks signals the reform’s success. However, the 30.2% incidence of surges in 2025 underscores the need to monitor extreme positive deviations.

• Continue strengthening information disclosure
• Monitor IPO clustering effects on market saturation
• Consider circuit-breaker mechanisms for extreme first-day moves

Policy Implications — For Investors & Issuers

The importance of fundraising scale and market timing has eclipsed simplistic “subscribe-to-all” strategies.

Issuers: Smaller offerings + favorable market windows = better first-day reception
Investors: Monitor pre-listing CSI 300 trends and IPO clustering density
Underwriters: Reputation alone (UW_rep) no longer significantly predicts outcomes

Conclusion

The Registration Reform Has
Fundamentally Reconfigured
the Determinants of Initial Returns

This study adopts an ordinal categorical lens to capture the economic thresholds of IPO first-day performance, affirming that the registration reform has not merely deregulated pricing but has fundamentally reconfigured the determinants of initial returns.

Thank You

SDSC 8013 — Statistical Methods for
Categorical Data Analysis
Semester B 2025/26

796 IPOs • 4 Years • 14 Predictors • 3 Models